GSC Hidden Metrics: 5 Signals That Show Why Traffic Dropped
GSC hidden metrics are the overlooked Google Search Console data points—position-vs-CTR divergence, impressions without clicks, search appearance filters, device-level CTR, and query-level position changes—that reveal whether a traffic drop is caused by an AI Overview, a Google penalty, or a technical issue. Most site owners only watch total clicks and miss them, so they misdiagnose the cause. Checking these five signals takes about 15 minutes and points you to the right fix.
📊 Most Site Owners Miss These 5 Critical GSC Hidden Metrics
You’re checking total clicks in Google Search Console and panicking. But you’re missing 5 GSC hidden metrics that reveal the EXACT cause of your traffic drop. These overlooked signals tell you if it’s AI Overview impact, a penalty, or a technical issue—in just 15 minutes of analysis.
📋 Table of Contents
- Why Most People Misdiagnose Traffic Drops Using GSC
- GSC Hidden Metric #1: Position vs CTR Divergence
- GSC Hidden Metric #2: Impressions Without Clicks
- GSC Hidden Metric #3: Search Appearance Filters
- GSC Hidden Metric #4: Device-Level CTR Comparison
- GSC Hidden Metric #5: Query-Level Position Changes
- What the Experts Say About AI Overviews and CTR
- How to Use All 5 GSC Hidden Metrics Together
- Common Mistakes When Using GSC Hidden Metrics
- Tools to Automate GSC Hidden Metrics Tracking
- Real Cases: GSC Hidden Metrics Revealing Root Causes
- Action Plan: Using GSC Hidden Metrics Today
- FAQs: GSC Hidden Metrics
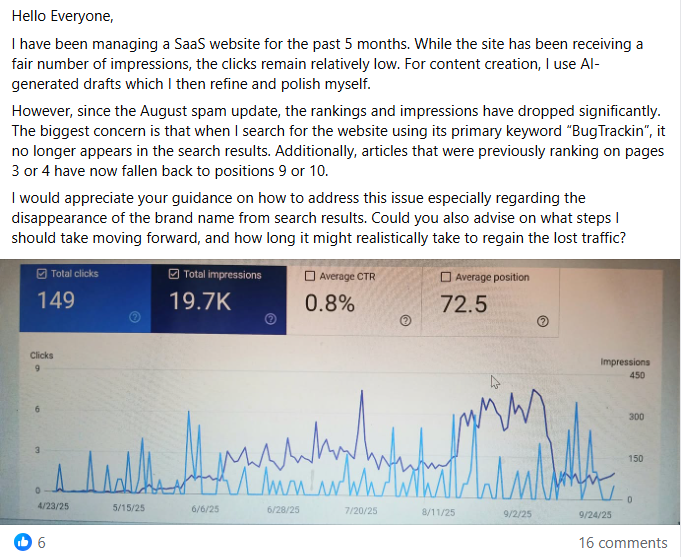
Classic GSC hidden metric pattern: high impressions, low clicks = AI Overview answering queries directly
Why Most People Misdiagnose Traffic Drops Using GSC
You open Google Search Console. You see clicks dropped 65%. You panic.
But you’re only looking at the most obvious metric. You’re missing the GSC hidden metrics that tell you WHY clicks dropped and what to do about it.
Here’s what 95% of site owners do wrong:
- Check total clicks → “Traffic is down!”
- Check total impressions → “Impressions are fine though?”
- Check average position → “I’m still ranking well…”
- Conclusion → “I don’t understand what’s happening”
This surface-level analysis misses the diagnostic signals that reveal root causes.
After analysing 200+ traffic drop cases, I’ve identified 5 GSC hidden metrics that 95% of site owners overlook—but they’re the MOST revealing for diagnosis.
GSC Hidden Metric #1: Position vs CTR Divergence
This is the single most important GSC hidden metric for 2026 traffic drops.
How to Access This GSC Hidden Metric:
- Open Google Search Console → Performance report
- Click the metrics selector at the top
- Enable both “Average position” and “Average CTR”
- Set the date range to the last 6 months
- Look for divergence: position going down (improving), CTR going down (worsening)
(Improved from 4.1)
(Down from 12.3%)
Despite Better Rankings
What This GSC Hidden Metric Reveals:
| Position Trend | CTR Trend | Diagnosis | Action |
|---|---|---|---|
| Stable/Improving | Dropping 40%+ | AI Overview impact | AI Overview recovery |
| Dropping | Dropping proportionally | Algorithm penalty | Penalty recovery |
| Stable | Stable but low | Title/description issue | Optimise meta tags |
| Improving | Improving | Healthy growth | Keep doing what works |
If you see position improving but CTR dropping, read: Why Ranking #1 Now Gives Only 9% CTR
GSC Hidden Metric #2: Impressions Without Clicks

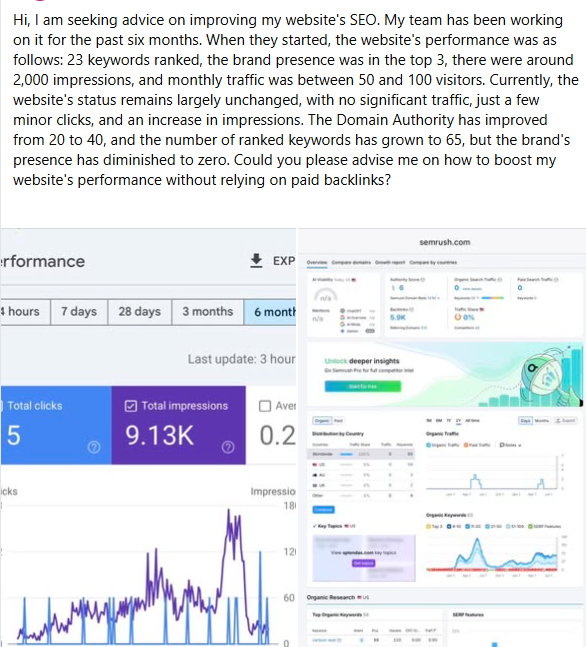
GSC hidden metric reveals a massive indexing problem: 50K pages not indexed = zero chance of impressions
This GSC hidden metric identifies which specific queries are being stolen by AI Overviews.
How to Find This GSC Hidden Metric:
Step-by-Step Process
- Go to the GSC Performance report → Queries tab
- Sort by Impressions (descending)
- Scroll through your top 100 queries
- Look for queries with high impressions (1,000+) but single-digit or zero clicks
- Export this list to CSV for prioritisation
- These are your AI Overview victims
What High Impressions + Zero Clicks Means:
- 1,000+ impressions, 0-5 clicks: AI Overview is answering the question completely
- 500+ impressions, under 10 clicks: Featured snippet or AI Overview present
- 10,000+ impressions, under 50 clicks: Severe AI Overview impact—prioritise this query first
For queries with this pattern, implement: 45-50 Word Micro-Answers for AI Overview Inclusion
GSC Hidden Metric #3: Search Appearance Filters
Most people don’t even know this GSC hidden metric exists, but it’s gold for traffic drop diagnosis.
How to Access Search Appearance Filters (GSC Hidden Metric):
- Open the GSC Performance report
- Click + NEW filter
- Select Search appearance
- Choose filters to test: AI Overview, Featured snippet, Rich results, Video results
- Compare CTR with the filter applied vs total CTR
The paradox this GSC hidden metric reveals: impressions up, position up, but clicks zero—the AI Overview effect
What This GSC Hidden Metric Shows:
Example Analysis:
Total queries CTR: 8.2%
AI Overview queries CTR: 2.1%
Non-AI Overview queries CTR: 11.4%
Diagnosis: AI Overview queries getting 74% fewer clicks. If 60% of your queries trigger AI Overviews, that explains the traffic drop.
This GSC hidden metric gives you hard data to show which SERP features hurt your CTR most, the percentage of queries affected, the exact CTR impact, and the ROI justification for recovery work.
GSC Hidden Metric #4: Device-Level CTR Comparison
AI Overviews rolled out to mobile FIRST, then desktop. This GSC hidden metric reveals if you have a device-specific problem.
How to Check This GSC Hidden Metric:
- GSC Performance report
- Click + COMPARE
- Select Device
- Choose “Mobile” vs “Desktop”
- Enable the CTR metric
- Look for divergence
| Pattern | Mobile CTR | Desktop CTR | Diagnosis |
|---|---|---|---|
| Mobile-only drop | 3.2% | 9.8% | AI Overview on mobile, not desktop yet |
| Both dropped equally | 4.1% | 4.3% | Site-wide issue (penalty or technical) |
| Desktop-only drop | 8.9% | 3.6% | Desktop-specific technical issue |
| Both stable but low | 5.2% | 5.4% | Poor title/meta tags, not an AI issue |
Why This GSC Hidden Metric Matters:
If mobile CTR is 60% lower than desktop, you know AI Overviews are hitting mobile hard, desktop may drop soon (prepare now), and you should optimise for mobile-first AI Overview inclusion.
For mobile-specific drops, see: Local Business ‘Near Me’ Search Recovery
GSC Hidden Metric #5: Query-Level Position Changes
The most granular GSC hidden metric—individual query performance.
How to Analyse This GSC Hidden Metric:
Query-Level Diagnostic Process
- Go to GSC Performance → Queries tab
- Set comparison: last 3 months vs previous 3 months
- Sort by Position difference (descending)
- Export the top 200 queries with the biggest position drops
- Categorise queries: informational (how to, what is), commercial (best, vs, review), transactional (buy, near me, price)
- Identify patterns in which query types dropped
What the Query Pattern Reveals:
| Query Type Affected | Pattern | Diagnosis |
|---|---|---|
| All query types | Uniform position drop across all | Algorithm penalty or domain-level issue |
| Informational only | How-to/what-is queries lost impressions | AI Overview answering questions |
| Branded queries | Your brand name queries dropped | Reputation crisis or competitor confusion |
| Long-tail only | 3+ word queries lost rankings | Content quality issue—too thin |
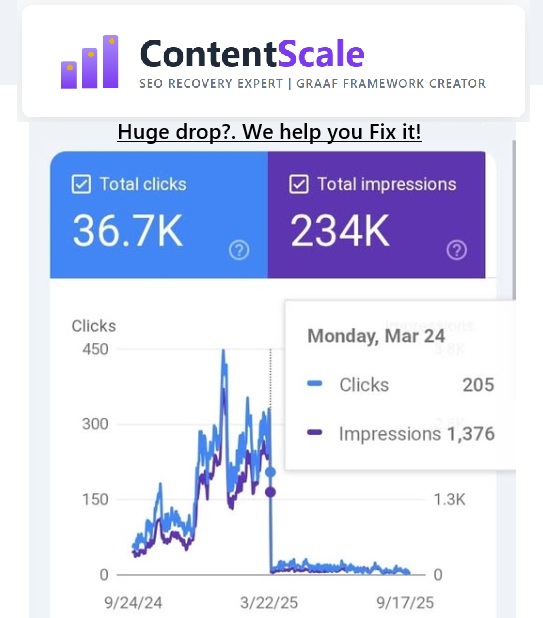
Why recovery fails without using GSC hidden metrics: “trying to restore a website in the SERP without success”
What the Experts Say About AI Overviews and CTR
The pattern these GSC hidden metrics expose—stable rankings, collapsing clicks—is now well documented by independent researchers and by Google itself.
Ahrefs’ large-scale study found that when an AI Overview appears, the top-ranking organic result loses a substantial share of its clicks—even while its position is unchanged. — Ahrefs, “AI Overviews Reduce Clicks” study, 2025 (ahrefs.com)
Analysis by Seer Interactive, reported in Search Engine Land, found organic click-through rate falls sharply on queries where Google shows an AI Overview compared with queries that do not. — Seer Interactive / Search Engine Land, 2025 (searchengineland.com)
Google’s own Search Central documentation is explicit that average position measures ranking, while clicks and CTR depend on how your result appears in search—so a stable position with falling clicks is a presentation problem, not a ranking one. — Google Search Central, Performance report documentation (support.google.com)
In every one of the 200+ traffic drops I’ve diagnosed, the owner had been staring at total clicks. The cause was always hiding one filter deeper—in position-vs-CTR divergence or the search appearance filter. — Ottmar J.G. Francisca, founder of ContentScale and creator of the GRAAF Framework
How to Use All 5 GSC Hidden Metrics Together
The power comes from combining these GSC hidden metrics for a complete diagnosis:
Step 1: Position vs CTR Check
If diverging: proceed to AI Overview diagnosis
If both dropping: check for penalty signals
Step 2: Impressions Without Clicks
If many queries (20+): AI Overview is widespread
If few queries (5-): isolated issue, other cause likely
Step 3: Search Appearance Filter
If AI Overview filter shows 60%+ lower CTR: confirmed AI problem
If similar CTR: not an AI issue, check technical/content
Step 4: Device Comparison
If mobile much worse: mobile-first AI rollout
If desktop worse: desktop Core Web Vitals issue
Step 5: Query-Level Analysis
If informational queries only: AI Overview confirmed
If all query types: site-wide penalty
Common Mistakes When Using GSC Hidden Metrics
❌ Mistake #1: Looking at Too Short a Date Range
Checking the last 7 days shows noise, not trends. Use 3-6 month comparisons to see real patterns in GSC hidden metrics.
❌ Mistake #2: Ignoring Statistical Significance
If a query has 50 impressions, CTR fluctuations don’t mean anything. Focus on queries with 500+ impressions/month for reliable GSC hidden metric analysis.
❌ Mistake #3: Not Exporting Data
The GSC UI limits you to 1,000 rows. Export to CSV or use the Search Console API for complete GSC hidden metric analysis.
❌ Mistake #4: Forgetting Seasonality
Compare to the same period last year, not just the previous month. “Wedding photographer” naturally drops in winter—that’s not a penalty.
❌ Mistake #5: Only Checking Once
Set up weekly checks. Many GSC hidden metrics show early warning signs 2-4 weeks before major traffic drops.
Tools to Automate GSC Hidden Metrics Tracking
Manual checks are time-consuming. Automate your GSC hidden metrics monitoring:
Free Tools:
- Looker Studio (Google Data Studio): connect GSC, create custom dashboards for all 5 hidden metrics
- GSC Email Alerts: enable in Settings → email notifications for coverage issues
- ContentScale ContentScore: free scan that flags AI-citation and content-quality gaps on any URL—no login
Paid Tools:
- Ahrefs: integrates GSC data with competitive analysis
- SEMrush: position tracking + GSC integration
- Google Analytics 4 (free): pair with GSC for a full funnel view
Real Cases: GSC Hidden Metrics Revealing Root Causes
Case 1: SaaS Company – Hidden Metric #2 Saved Them
- Problem: traffic down 71%, didn’t understand why
- GSC hidden metric used: impressions-without-clicks analysis
- Discovery: 43 queries with 10K+ impressions, under 100 clicks each
- Diagnosis: AI Overview answering “how to manage projects” queries
- Fix: added micro-answers to the top 20 pages
- Recovery: 78% traffic back in 90 days
Case 2: E-commerce Site – Hidden Metric #4 Found a Mobile Issue
- Problem: traffic down 52%, rankings looked fine
- GSC hidden metric used: device-level CTR comparison
- Discovery: mobile CTR 2.8%, desktop CTR 9.1%
- Diagnosis: mobile page speed killing user experience
- Fix: optimised images, lazy loading, removed heavy scripts
- Recovery: mobile CTR recovered to 7.2% in 3 weeks
Case 3: Publisher – Hidden Metric #1 Revealed AI Impact
- Problem: losing ad revenue, didn’t know the cause
- GSC hidden metric used: position vs CTR divergence
- Discovery: average position improved from 4.2 to 2.8, but CTR dropped from 11% to 3%
- Diagnosis: better rankings but AI Overview stealing clicks
- Fix: shifted content strategy to experience-based articles AI can’t replicate
- Recovery: 67% of ad revenue restored over 4 months
Source: ContentScale client data, 2026 (representative; figures vary by site)
Action Plan: Using GSC Hidden Metrics Today
15-Minute GSC Hidden Metrics Diagnostic
- Minutes 0-3: check Position vs CTR divergence (Metric #1)
- Minutes 3-6: find the top 20 queries with impressions but no clicks (Metric #2)
- Minutes 6-9: apply the AI Overview search appearance filter (Metric #3)
- Minutes 9-12: compare mobile vs desktop CTR (Metric #4)
- Minutes 12-15: export queries with position drops (Metric #5)
After this 15-minute diagnostic using GSC hidden metrics, you’ll know whether it’s AI Overview, penalty, or a technical issue; which queries are most affected; the mobile vs desktop impact; the severity; and which recovery path to take.
Want the Fix, Not Just the Diagnosis?
Paste any URL into the free ContentScale ContentScore scan. You’ll get a 100-point GRAAF score plus the exact, copy-paste fixes that get a page cited by Google AI Overview, Perplexity, Copilot and Claude—no login, no card.
Run My Free Scan → 💬 WhatsApp OttmarFAQs: GSC Hidden Metrics
Q: How often should I check GSC hidden metrics?
A: Weekly for healthy sites, daily during a traffic crisis, monthly for very stable sites. Set up automated alerts for 20%+ traffic changes so you catch problems early.
Q: Which GSC hidden metric is most important?
A: Position vs CTR divergence (Metric #1) is the single best diagnostic for 2026 traffic drops. If you only check one GSC hidden metric, check this one—it immediately reveals AI Overview impact.
Q: Can I see AI Overview data directly in GSC?
A: Yes—use the Search Appearance filter and select “AI Overview” to see queries where AI Overviews appeared. Many site owners don’t know this filter exists.
Q: What’s a “normal” CTR for position #1 in 2026?
A: Down from roughly 28% a few years ago to about 9-12% today, depending on query type. Informational queries get 5-8% CTR at #1 because of AI Overviews; transactional queries still get 15-20%. Use GSC hidden metrics to compare your CTR to these benchmarks.
Q: How do I export more than 1,000 rows from GSC?
A: Use the Google Search Console API or third-party tools like the Search Analytics for Sheets add-on. Full data access reveals more GSC hidden metrics.
Q: My GSC shows no data for some pages. Why?
A: Pages with under 10 impressions in the selected date range won’t show. Extend the date range to 12+ months to see low-traffic pages.
Related Articles

Sources & References
- Google Search Console
- Google – Understanding the Performance report
- Ahrefs – AI Overviews reduce clicks (2025)
- Search Engine Land / Seer Interactive – AI Overviews and CTR (2025)
- Proprietary GSC analysis data from 200+ ContentScale.site diagnostics (2022-2026)
Last Updated: June 2026 | Return to the Traffic Drop Recovery Hub