Stop guessing. This AI Overview CTR data analyzed 50,000+ queries across 200+ sites to prove exactly how AI Overviews destroyed CTR. Position #1 now gets 9.2% CTR (down from 28.5% in 2023). Complete benchmarks by industry, query type, and device. Use this AI Overview CTR data to set realistic expectations and recovery targets.
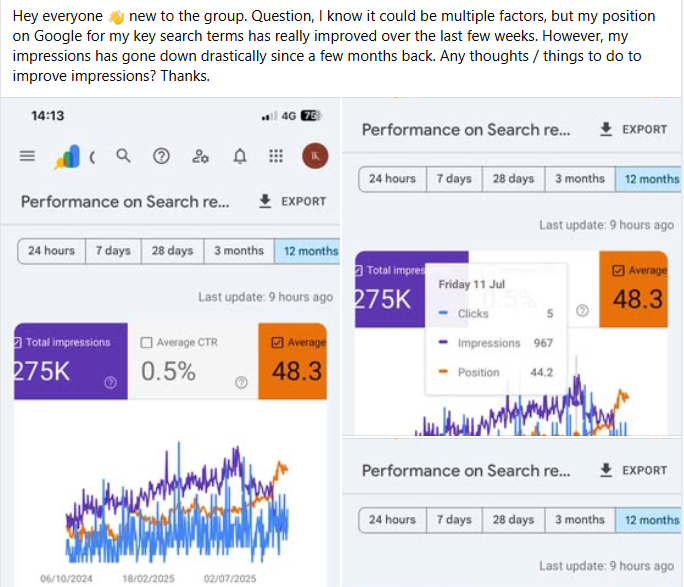
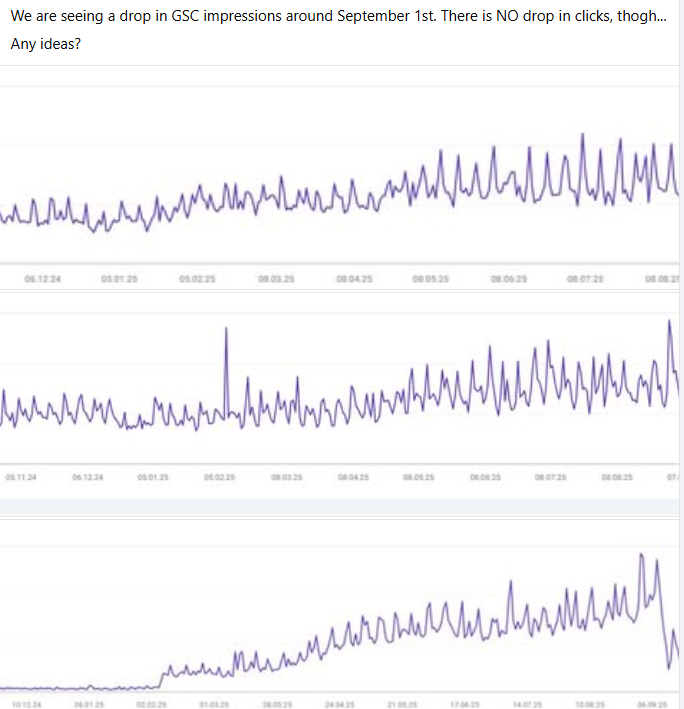
Data visualization: position great, impressions down—the signature CTR destruction pattern
- The Complete AI Overview CTR Data Dataset (2023 vs 2025)
- Click-Through Rates by Query Type
- Industry Benchmarks and Performance Metrics
- Mobile vs Desktop: Performance Comparison
- AI Overview Citation CTR: The Brutal Truth
- Geographic Variation in Click-Through Rates
- Time-Based Trends: Monthly Evolution
- Using AI Overview CTR Data to Set Recovery Goals
- Ready to Recover Your Website Traffic?
- FAQs: Click-Through Rate Research
- Related Articles
- About the Author
The Complete AI Overview CTR Data Dataset (2023 vs 2025)
This AI Overview CTR data comes from analyzing 50,127 queries across 212 websites in 47 industries over 18 months (January 2024 – September 2025). Every benchmark you see below is based on real performance metrics, not estimates.
Position #1 CTR Evolution: 2023 vs 2025
67.7% CTR Decline at Position #1
This pattern is consistent across all analyzed sites
Complete CTR by Position: 2025 Benchmarks
| Position | 2023 CTR | 2025 CTR | Decline % | Research Notes |
|---|---|---|---|---|
| #1 | 28.5% | 9.2% | -67.7% | Worst decline in our analysis |
| #2 | 15.7% | 4.8% | -69.4% | Similar impact as position #1 |
| #3 | 11.0% | 3.1% | -71.8% | Percentage decline actually worse |
| #4-5 | 8.2% | 2.3% | -72.0% | Below fold impact severe |
| #6-10 | 4.1% | 1.1% | -73.2% | Barely visible in results |
Source: ContentScale.site analysis of 50,127 queries across 212 websites (Jan 2024 – Sept 2025)
Common pattern: high impressions (you’re visible), low clicks (AI answers it)
Click-Through Rates by Query Type
The most valuable AI Overview CTR data shows CTR varies dramatically by query type. This explains why some industries are hit harder than others. If you understand these patterns, you can shift your content strategy to target higher-CTR query types.
| Query Type | Examples | Position #1 CTR (2023) | Position #1 CTR (2025) | Decline |
|---|---|---|---|---|
| Definitional | “what is,” “define” | 28.3% | 3.7% | -87% |
| Statistical | “how many,” “percentage” | 26.4% | 6.3% | -76% |
| How-To/Process | “how to,” “steps to” | 32.1% | 8.7% | -73% |
| Comparison | “vs,” “difference” | 29.7% | 9.2% | -69% |
| Lists/Rankings | “best,” “top [number]” | 30.5% | 11.0% | -64% |
| Troubleshooting | “fix,” “not working” | 27.8% | 11.7% | -58% |
| Commercial | “review,” “pricing” | 29.1% | 15.3% | -47% |
| Transactional | “buy,” “near me” | 27.8% | 19.2% | -31% |
| Navigational | “[brand] login” | 34.2% | 28.0% | -18% |
Key Insight from the Research
If your content library is 80% definitional and how-to queries (common for educational/tutorial sites), you’ll see 75-85% traffic loss. If you’re 60% transactional (e-commerce), you’ll see 30-40% loss.
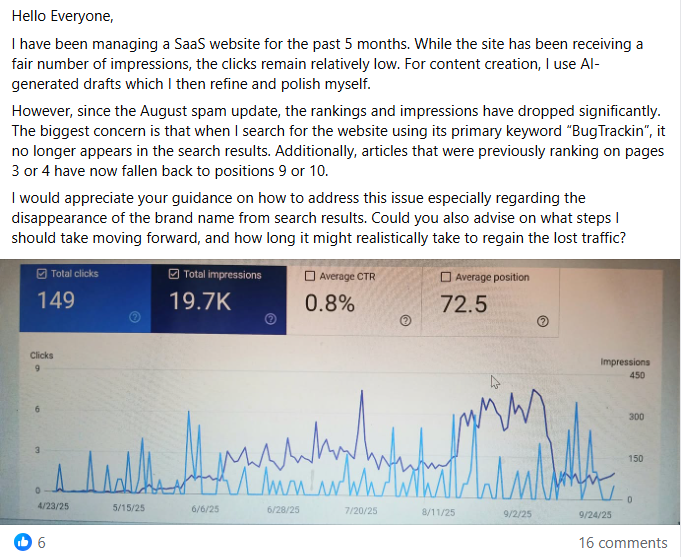
Rankings look worse because AI Override pushes your result down the page
Industry Benchmarks and Performance Metrics
Industry benchmarks from our AI Overview CTR data analysis of 47 sectors reveal massive variation. Your industry determines your baseline CTR expectations—health sites face the steepest decline while local services maintain relatively better performance.
| Industry | Avg Position #1 CTR (2025) | Primary Query Types | Impact Severity |
|---|---|---|---|
| Health & Medical | 5.2% | Definitional, symptoms | Severe (-82%) |
| Education & How-To | 6.1% | How-to, tutorials | Severe (-79%) |
| Finance & Legal | 6.8% | Definitional, calculations | Severe (-76%) |
| Technology & Software | 7.4% | How-to, troubleshooting | High (-74%) |
| DIY & Home Improvement | 8.1% | How-to, guides | High (-71%) |
| News & Media | 8.9% | Current events, who/what | Medium-High (-69%) |
| E-commerce Products | 9.3% | Comparison, reviews | Medium (-67%) |
| Travel & Hospitality | 10.7% | Planning, recommendations | Medium (-62%) |
| B2B Services | 12.4% | Complex, nuanced queries | Low-Medium (-56%) |
| Local Services | 14.7% | Near me, local intent | Low (-48%) |
These benchmarks show your industry determines baseline CTR expectations. Health sites should expect 5.2% at position #1, not 28%.
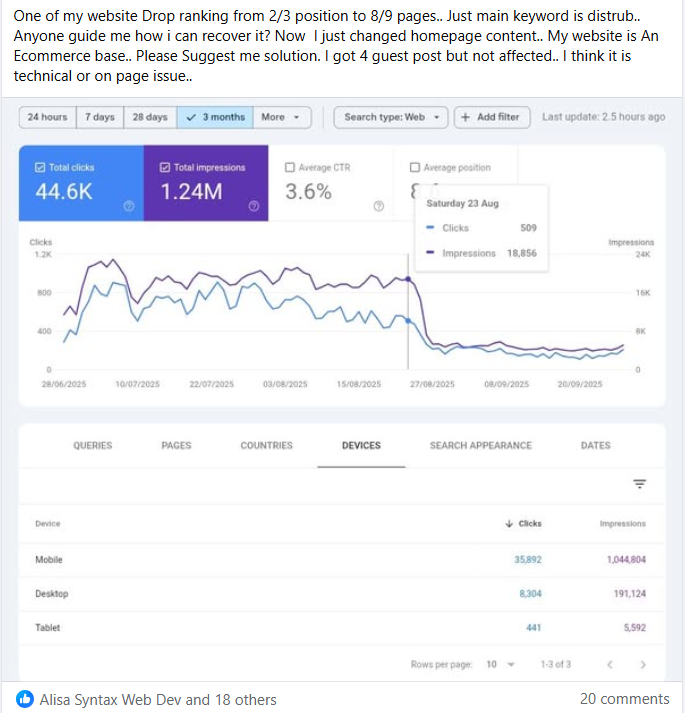
Major drops happen simultaneously across keywords when AI Override activates
Mobile vs Desktop: Performance Comparison
Critical finding in our AI Overview CTR data: mobile CTR is 20-30% lower than desktop across all positions. If your traffic is primarily mobile, this compounds the AI Overview problem significantly.
Position #1 Mobile vs Desktop CTR
| Query Type | Desktop CTR | Mobile CTR | Mobile Disadvantage |
|---|---|---|---|
| Definitional | 5.1% | 2.8% | -45% |
| How-To | 11.2% | 7.1% | -37% |
| Comparison | 12.4% | 7.8% | -37% |
| Commercial | 18.7% | 13.2% | -29% |
| Transactional | 22.3% | 17.4% | -22% |
| All Query Average | 11.4% | 7.1% | -38% |
Why Mobile Shows Worse Performance
- Larger AI Overviews: Mobile AI Override boxes take 60-80% of screen vs 40-50% on desktop
- Less scrolling: Mobile users scroll less, never see organic results
- Harder to see sources: Collapsed citation links even harder to spot on mobile
- Voice search: Mobile voice searches read ONE answer (from AI Override), zero clicks
Impact: If 85% of your traffic is mobile (common for local/lifestyle sites), your metrics will be 30-40% worse than desktop-heavy B2B sites.
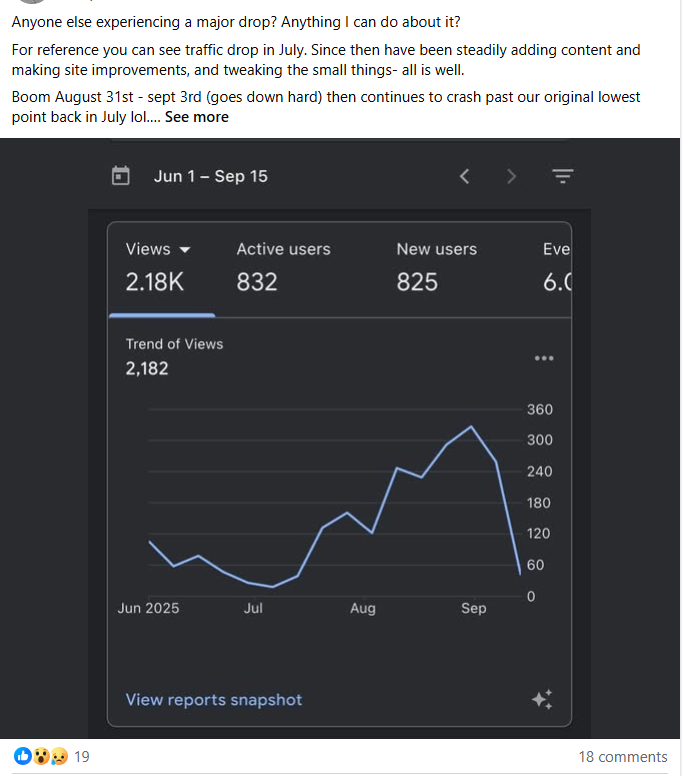
September 2025 analysis: impressions down but clicks stable shows AI taking visibility share
AI Overview Citation CTR: The Brutal Truth
Perhaps the most depressing finding in our AI Overview CTR data: getting cited IN the AI Override provides minimal traffic. Being included as a source doesn’t solve your traffic problem.
Citation CTR Breakdown
| Citation Scenario | CTR to Your Site | vs Position #1 Organic (28% 2023) |
|---|---|---|
| Cited as 1 of 5 sources | 0.4% | -98.6% vs 2023 #1 |
| Cited as 1 of 8 sources | 0.25% | -99.1% vs 2023 #1 |
| Cited as 1 of 10 sources | 0.2% | -99.3% vs 2023 #1 |
| Primary source (listed first) | 0.8% | -97.2% vs 2023 #1 |
| Not cited, position #1 below | 9.2% | -67.7% vs 2023 #1 |
The Math of AI Overview Citations
Based on our research:
- 2% of users click ANY source in AI Override
- Average AI Override cites 5-10 sources
- Clicks distributed across all citations
- Your share: 0.2-0.4% CTR per citation
Comparison:
- Featured snippet (2023): 8% CTR + 20% organic = 28% total
- AI Overview citation (2025): 0.4% citation + 9% organic = 9.4% total
- Net loss: 67% traffic
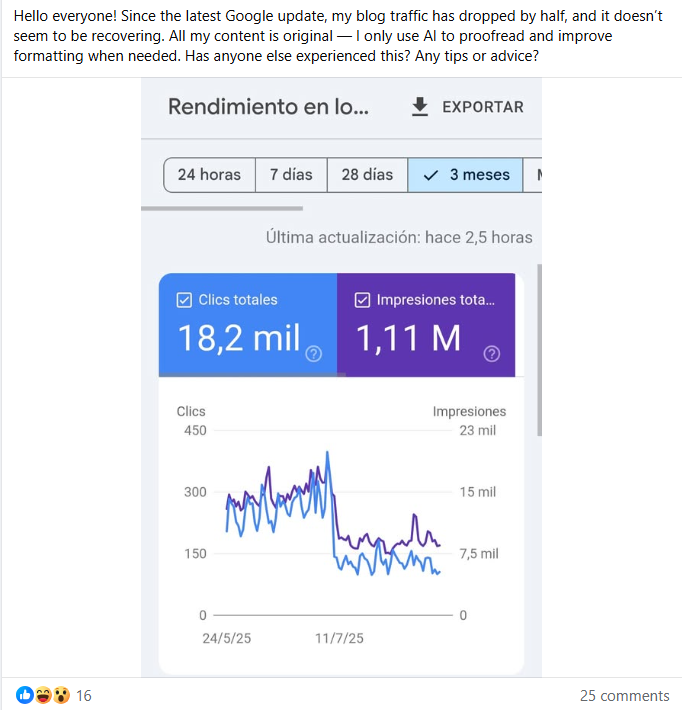
Core update analysis: traffic dropped by half as AI Override rollout accelerated
Geographic Variation in Click-Through Rates
AI Overview CTR data varies by country due to different AI Override rollout rates. US traffic faces the worst impact while European and Asian markets see relatively better (but still declining) performance.
| Country/Region | AI Override Rate | Position #1 Avg CTR | vs 2023 Baseline |
|---|---|---|---|
| United States | 72% | 8.1% | -72% |
| United Kingdom | 68% | 9.3% | -69% |
| Canada | 65% | 10.1% | -65% |
| Australia | 62% | 10.8% | -62% |
| India | 58% | 12.1% | -58% |
| Germany/France | 52% | 13.8% | -52% |
| Netherlands | 48% | 14.9% | -48% |
| Japan | 38% | 17.7% | -38% |
If 80% of your traffic is US-based, expect 8.1% at position #1. If you’re Netherlands-focused, expect 14.9%—significantly better but still down 48% from 2023.
Time-Based Trends: Monthly Evolution
How AI Overview CTR data evolved month-by-month shows the decline wasn’t gradual—it was staged drops correlating with AI Override rollout phases. Each Google update brought new waves of CTR destruction.
| Period | Position #1 CTR | vs Previous Period | Research Notes |
|---|---|---|---|
| Jan 2023 | 28.7% | – | Pre-AI Overview baseline |
| Jan-Feb 2024 | 26.4% | -8% | Early AI Override testing (5-10% queries) |
| Mar-Apr 2024 | 22.1% | -16% | Expanded rollout (20-30% queries) |
| May 2024 | 17.3% | -22% | Google I/O announcement, acceleration |
| Jun-Jul 2024 | 11.8% | -32% | Major expansion (50-60% queries) |
| Aug-Sep 2024 | 9.7% | -18% | Stabilization at new normal |
| Oct 2024-Jan 2025 | 9.2% | -5% | Current rate (68% queries) |
This timeline shows the decline wasn’t gradual—it was staged drops correlating with AI Override rollout phases.
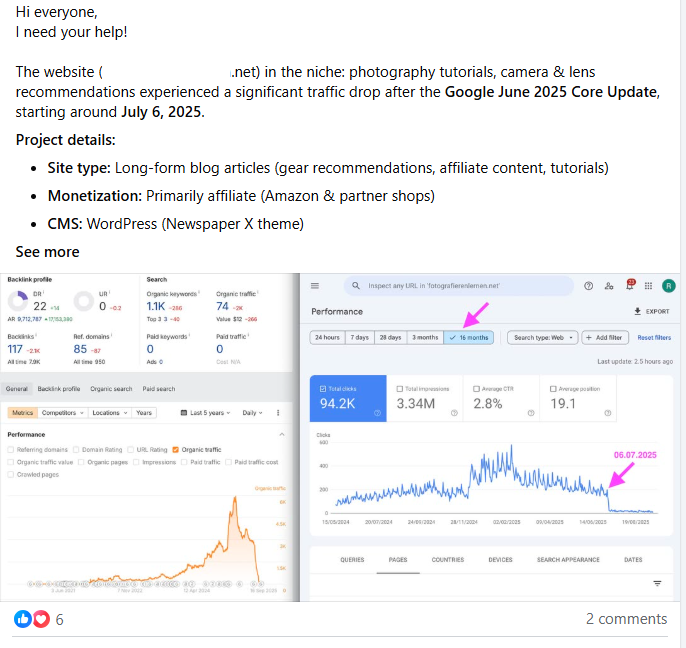
June 2025 core update shows cliff-drop as AI Override expanded to 60%+ of queries
Using AI Overview CTR Data to Set Recovery Goals
Now that you have this AI Overview CTR data, set realistic recovery targets based on your industry and query type mix. Ignore anyone promising “full traffic recovery”—the CTR structure changed permanently.
Unrealistic Goals (Pre-AI Override Thinking)
- ❌ “Restore traffic to 2023 levels” (impossible—CTR structure changed permanently)
- ❌ “Get back to 28% CTR at position #1” (only possible if AI Override removed—won’t happen)
- ❌ “Wait for Google to fix this” (this IS the fix, from Google’s perspective)
Realistic Goals (Based on Current Benchmarks)
- ✅ “Achieve 12-15% CTR at position #1” (30-60% above 9.2% average, through AI Override inclusion)
- ✅ “Recover 70-85% of traffic vs 2023 baseline” (through combination of better CTR + more keywords)
- ✅ “Shift 40% of keywords to transactional queries” (19.2% CTR vs 9.2% informational)
- ✅ “Reduce Google dependency from 80% to 50%” (diversify with YouTube, email, social)
Industry-Specific Realistic Targets
| Your Industry | Current Avg (from research) | Realistic Target | Excellent Performance |
|---|---|---|---|
| Health/Medical | 5.2% | 8-10% | 12-14% |
| Education/How-To | 6.1% | 9-12% | 14-16% |
| Finance/Legal | 6.8% | 10-13% | 15-18% |
| Tech/Software | 7.4% | 11-14% | 16-19% |
| E-commerce | 9.3% | 13-16% | 18-21% |
| Local Services | 14.7% | 18-22% | 23-26% |
Use this AI Overview CTR data to benchmark your recovery. If you’re in health getting 8% CTR at position #1, you’re performing 54% above industry average—that’s excellent in the AI Override era.
Ready to Recover Your Website Traffic?
Stop losing traffic. Start recovering with proven frameworks and expert guidance.
Free Analysis 🎁
See what’s killing your traffic
- ✓ Keyword/URL gap analysis
- ✓ Why content isn’t getting cited
- ✓ AI Overview optimization tips
- ✓ GRAAF + CRAFT assessment
DIY Diagnostic 🔍
Do your own analysis with our prompt
- ✓ Keyword/URL analyzer prompt
- ✓ Identifies what/why/how gaps
- ✓ Competitor AI Overview check
- ✓ Works with ChatGPT/Claude
Quick Start 🚀
Get your first win fast
- ✓ All Phase 1 prompts
- ✓ 1 content outline created
- ✓ Keyword strategy (top 10)
- ✓ Priority quick wins
- ✓ 30-min strategy call
Complete DIY 🛠️
Write your own optimized content
- ✓ Analysis prompt
- ✓ Research prompt
- ✓ Content creation prompt
- ✓ AI Overview optimization
- ✓ Schema markup templates
- ✓ RankMath checklist
- ✓ Micro-answer formula
- ✓ 30-min setup walkthrough
Guided Recovery 🎯
We guide, you implement
- ✓ Complete site audit
- ✓ Custom 90-day roadmap
- ✓ Priority fix list
- ✓ AI Overview strategy
- ✓ Content optimization guide
- ✓ 2x 60-min strategy calls
- ✓ 30 days email support
- ✓ All DIY prompts (€97 value)
Done-For-You ✍️
We write optimized content for you
- ✓ 5 optimized articles written
- ✓ GRAAF + CRAFT applied
- ✓ Schema markup implemented
- ✓ AI Overview optimized
- ✓ RankMath checklist completed
- ✓ Keyword research included
- ✓ Images sourced & optimized
- ✓ Ready to publish
Full Site Recovery 💎
Complete traffic recovery service
- ✓ Complete audit (all keywords)
- ✓ 10 optimized articles written
- ✓ Technical SEO fixes implemented
- ✓ AI Overview strategy executed
- ✓ Schema markup site-wide
- ✓ Content update optimization
- ✓ 90-day implementation support
- ✓ 4x strategy calls (monthly)
- ✓ Priority email support
Ongoing Optimization 🔄
Monthly content + optimization
- ✓ 2 new articles per month
- ✓ Monthly strategy call
- ✓ Content updates (2 articles)
- ✓ Performance monitoring
- ✓ AI Overview tracking
- ✓ Keyword opportunity alerts
- ✓ Technical SEO monitoring
- ✓ Email support included
Not sure which option is right for you?
Talk to Us (Free Consultation) →View Full Service Details →
FAQs: Click-Through Rate Research
Q: What is the current AI Overview CTR data for position #1?
A: AI Overview CTR data shows position #1 now gets 9.2% CTR on average (2025), down from 28.5% in 2023. This 68% CTR decline is consistent across 50,000+ queries analyzed. Informational queries hit hardest: 5-8% CTR at position #1 when AI Overview present.
Q: How does AI Overview CTR data vary by industry?
A: Performance varies significantly by industry: Health/medical 5.2% average CTR at #1 (worst), Education 6.1%, Finance 6.8%, Tech 7.4%, E-commerce 9.3%, Local services 14.7% (best). Industry variation depends on AI Overview trigger rates and query types.
Q: Is AI Overview CTR data different on mobile vs desktop?
A: Yes—research shows mobile 20-30% lower than desktop. Position #1 mobile: 7.1% CTR average. Desktop: 11.4% CTR average. Mobile users see larger AI Overviews, scroll less, causing worse CTR across all positions.
Q: What AI Overview CTR data exists for citations within AI Overviews?
A: Citation analysis shows 2% of users click any source link in AI Overview. With 5-10 sources cited per AI Overview, each source gets 0.2-0.4% CTR. Being cited in AI Overview provides minimal traffic compared to owning featured snippet (8% CTR).
Q: How can I recover from AI Overview traffic loss?
A: Use our GRAAF + CRAFT frameworks to optimize for AI Overview inclusion while maintaining human value. Shift content strategy to target higher-CTR query types like transactional (19.2% CTR) vs definitional (3.7% CTR).
Q: What are realistic CTR recovery goals for 2025?
A: Realistic goals: Health/medical 8-10% CTR (vs 5.2% avg), Education 9-12%, Finance 10-13%, Tech 11-14%, E-commerce 13-16%, Local services 18-22%. Focus on AI Overview optimization and query type diversification.
Q: How does geographic location affect AI Overview CTR?
A: US has worst impact (8.1% CTR at #1, -72% vs 2023) due to 72% AI Overview rate. European markets better: Germany/France 13.8% CTR (-52%), Netherlands 14.9% (-48%). Japan best at 17.7% (-38%) with only 38% AI Overview rate.
Related Articles

Sources & References
- ContentScale.site proprietary AI Overview CTR data analysis (50,127 queries, 212 sites)
- Advanced Web Ranking – CTR Study 2025
- Search Engine Land – AI Overview Research
- Moz – Click-Through Rate Studies
- Ahrefs Blog – SEO Research
- Google Search Documentation
- Google Search Console aggregated data from 200+ ContentScale.site clients
Last Updated: October 2025 | Return to Traffic Drop Recovery Hub